
Friday, 18 November 2022
Wednesday, 16 November 2022

Monday, 7 November 2022

Wednesday, 21 September 2022


Saturday, 10 September 2022

Thursday, 8 September 2022


Tuesday, 6 September 2022

Tuesday, 30 August 2022

Monday, 29 August 2022

Friday, 26 August 2022

Thursday, 11 August 2022
Saturday, 23 July 2022

Saturday, 9 July 2022

Friday, 1 July 2022

Tuesday, 21 June 2022
EXPORT IMPORT FINANCE
June 25, 2022 | 10.00 AM to 1.00 PM
Register: https://www.amaindia.org/ama-events-programmes/jun34/


Sunday, 12 June 2022

Saturday, 21 May 2022

Wednesday, 4 May 2022
How to recover export debt

Sunday, 10 April 2022
@Ahmedabad Management Association.
@Ahmedabad Management Association. Register: https://www.amaindia.org/amain/wp-content/uploads/2022/04/Opportunities-for-Export-of-Potential-Products-Apr.-15-2022.pdf

Monday, 4 April 2022
Webinar on LC documents UCPDC 600

Wednesday, 16 March 2022

Monday, 14 March 2022
WEBINAR ON ECGC
Join its free. Register:
https://forms.dripcapital.com/webinar-ecgc-payment-credit-policy?utm_source=newsletter&utm_medium=organic

Saturday, 5 March 2022
FTA WITH CANADA
FTA With Canada: Tremendous potential to grow bilateral trade with Canada
Read more at:
https://economictimes.indiatimes.com/news/economy/foreign-trade/tremendous-potential-to-grow-bilateral-trade-with-canada-goyal/articleshow/87937372.cms?utm_source=contentofinterest&utm_medium=text&utm_campaign=cppst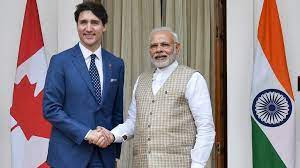
Monday, 28 February 2022
Does India need to worry as key Russian banks are blocked from SWIFT? https://lnkd.in/drKXHyRU
Does India need to worry as key Russian banks are blocked from SWIFT?
https://lnkd.in/drKXHyRU

Sunday, 20 February 2022
INDIA - Australia FREE TRADE PACT
Ater UAE now Australia FREE TRADE PACT: https://www.thehindu.com/news/international/india-australia-hold-talks-on-free-trade-pact/article38408641.ece
Saturday, 19 February 2022
Potential buyers & seller for export import business
Do you want genuine buyers & suppliers for your Export-Import Business? Contact +91 7878045651 bhatiajd@gmail.com www.bhatiaexport.in

Friday, 18 February 2022
INDIA UAE TRADE AGREEMENT
https://economictimes.indiatimes.com/news/economy/foreign-trade/india-uae-eye-100-billion-in-annual-trade-after-signing-trade-pact/articleshow/89669977.cms

Tuesday, 8 February 2022
Watch me on Trade Promotion Council of India, New Delhi
Watch me on Trade Promotion Council of India, New Delhi
Export Finance & Forex Solution for Indian Exporters
https://www.youtube.com/watch?v=g5h8mddmG5Q
Monday, 7 February 2022
Trade Promotion Council of India, New Delhi Export Finance & Forex Solution
Trade Promotion Council of India, New Delhi
Export Finance & Forex Solution
https://zoom.us/webinar/register/WN_BZtd-L4yTi6Bk__VdGN-hQ
Wednesday, 26 January 2022
FEMA ON EXPORT
FEMA - On Friday 28-01-2022 @ 2 PM Reg. here for free https://app.eepcindia.org/ems/seminar_management/seminar_registration/MjI4
Tuesday, 18 January 2022
Export Contract Webinar
Webinar on Export Contract. To register, please click here
https://forms.dripcapital.com/webinar-drafting-of-export-contract

Sunday, 16 January 2022
Export import guide
To buy my Book Complete Guide Export Import click on below link
https://www.flipkart.com/complete-guide-export-import-beginners-established-companies-dgft-pga-customs-banking-certification-etc/p/itmb0ea1a7be14ae?pid=9789392236044
Wednesday, 12 January 2022

Monday, 3 January 2022
Historic and Highest Ever Merchandise Export Figures for December-21
PrintXClose
Press Information Bureau
Government of India
Ministry of Commerce & Industry
03 JAN 2022 7:08PM by PIB Delhi
Historic and Highest Ever Merchandise Export Figures for December - Shri Piyush Goyal
As per the Preliminary Data for December 2021, India’s merchandise export in December 2021 was USD 37.29 billion, the highest ever monthly achievement, which shows an increase of 37.0% over USD 27.22 billion in December 2020 and an increase of 37.55% over USD 27.11 billion in December 2019.
Shri Piyush Goyal, Union Minister for Commerce and Industry, Textiles, Consumer Affairs, Food & Public Distribution called it a historic achievement and attributed it to the leadership of Prime Minister Shri Narendra Modi. He also congratulated all the EPCs, exporters and Indian Embassy officials all across the globe for contributing to this historic achievement.
India’s merchandise export in April-December 2021 was USD 299.74 billion, an increase of 48.85% over USD 201.37 billion in April-December 2020 and an increase of 25.80% over USD 238.27 billion in April-December 2019.
India’s merchandise import in December 2021 was USD 59.27 billion, an increase of 38.06% over USD 42.93 billion in December 2020 and an increase of 49.7% over USD 39.59 billion in December 2019.
India’s merchandise import in April-December 2021 was USD 443.71 billion, an increase of 69.27% over USD 262.13 billion in April-December 2020 and an increase of 21.84% over USD 364.18 billion in April-December 2019.
The trade deficit in December 2021 was USD 21.99 billion, while it was 143.97 billion USD during April-December 2021.
Statement 1: India’s Merchandise Trade in December 2021
Value in Billion USD
% Growth
Dec-21
Dec-20
Dec-19
Dec-21 over Dec-20
Dec-21 over Dec-19
Exports
37.29
27.22
27.11
37.00
37.55
Imports
59.27
42.93
39.59
38.06
49.70
Deficit
21.99
15.72
12.49
39.90
76.10
Statement 2: India’s Merchandise Trade in Apr-Dec 2021
Value in Billion USD
% Growth
Apr-Dec21
Apr-Dec20
Apr-Dec19
Apr-Dec 21 over Apr-Dec 20
Apr-Dec 21 over Apr-Dec 19
Exports
299.74
201.37
238.27
48.85
25.80
Imports
443.71
262.13
364.18
69.27
21.84
Deficit
143.97
60.76
125.91
136.94
14.34
Value of non-petroleum exports in December 2021 was 31.67 USD billion, registering a positive growth of 27.31% over non-petroleum exports of USD 24.88 billion in December 2020 and a positive growth of 34.92% over non-petroleum exports of USD 23.48 billion in December 2019.
Value of non-petroleum imports was USD 43.37 billion in December 2021 with a positive growth of 30.22% over non-petroleum imports of USD 33.31 billion in December 2020 and a positive growth of 50.20% over non-petroleum imports of USD 28.88 billion in December 2019.
Statement 3: Merchandise Non-POL Trade in December 2021
Value in Billion USD
% Growth
Dec-21
Dec-20
Dec-19
Dec-21 over Dec-20
Dec-21 over Dec-19
Exports
31.67
24.88
23.48
27.31
34.92
Imports
43.37
33.31
28.88
30.22
50.20
The cumulative value of non-petroleum exports in April-December 2021 was USD 257.14 billion, an increase of 39.82% over USD 183.91 billion in April-December 2020 and an increase of 24.74% over USD 206.13 billion in April-December 2019.
The cumulative value of non-petroleum imports in April-December 2021 was USD 325.73 billion, showing an increase of 56.41% compared to non-oil imports of USD 208.25 billion in April-December 2020 and an increase of 21.78% compared to non-oil imports of USD 267.47 billion in April-December 2019.
Statement 4: Merchandise Non-POL Trade Apr-Dec 2021
Value in Billion USD
% Growth
Apr-Dec21
Apr-Dec20
Apr-Dec19
Apr-Dec21 over Apr-Dec20
Apr-Dec21 over Apr-Dec19
Exports
257.14
183.91
206.13
39.82
24.74
Imports
325.73
208.25
267.47
56.41
21.78
Value of non-petroleum and non-gems and jewellery exports in December 2021 was USD 28.69 billion, registering a positive growth of 28.64% over non-petroleum and non-gems and jewellery exports of USD 22.30 billion in December 2020 and a positive growth of 36.21% over non-petroleum and non-gems and jewellery exports of USD 21.06 billion in December 2019.
Value of non-oil, non-GJ (gold, silver & Precious metals) imports was USD 35.57 billion in December 2021 with a positive growth of 34.68% over non-oil and non-GJ imports of USD 26.41 billion in December 2020 and a positive growth of 47.75% over non-oil and non-GJ imports of USD 24.07 billion in December 2019.
Statement 5: Merchandise Non-POL Non-GJ Trade in December 2021
Value in Billion USD
% Growth
Dec-21
Dec-20
Dec-19
Dec-21 over Dec-20
Dec-21 over Dec-19
Exports
28.69
22.30
21.06
28.64
36.21
Imports
35.57
26.41
24.07
34.68
47.75
The cumulative value of non-petroleum and non-gems and jewellery exports in April-December 2021 was USD 228.25 billion, an increase of 36.66% over cumulative value of non-petroleum and non-gems and jewellery exports of USD 167.02 billion in April-December 2020 and an increase of 28.12% over cumulative value of non-petroleum and non-gems and jewellery exports of USD 178.15 billion in April-December 2019.
Non-oil, non-GJ (Gold, Silver & Precious Metals) imports was USD 263.66 billion in April-December 2021, recording a positive growth of 47.33%, as compared to non-oil and non-GJ imports of USD 178.96 billion in April-December 2020 and a positive growth of 17.20% over USD 224.96 billion in April-December 2019.
Statement 6: Merchandise Non-POL Non-GJ Trade Apr-Dec 2021
Value in Billion USD
% Growth
Apr-Dec 21
Apr-Dec 20
Apr-Dec 19
Apr-Dec 21 over Apr-Dec 20
Apr-Dec 21 over Apr-Dec 19
Exports
228.25
167.02
178.15
36.66
28.12
Imports
263.66
178.96
224.96
47.33
17.20
Top 10 major commodity groups covering 79% of total exports and showing positive growths in December 2021 over corresponding month of previous year, are –
Statement 7: Exports of Top 10 Major Commodity Groups
Value of Export (Million US$)
Share (%)
Growth (%)
Major Commodity Group
Dec-21
Dec-20
Dec-21
Dec-21 over Dec-20
Engineering goods
9708.94
7072.63
26.04
37.27
Petroleum products
5611.70
2336.63
15.05
140.16
Gems and Jewellery
2982.55
2575.67
8.00
15.80
Organic and Inorganic chemicals
2646.32
2100.00
7.10
26.01
Drugs and Pharmaceuticals
2288.20
2203.53
6.14
3.84
Electronic goods
1663.70
1248.33
4.46
33.27
RMG of all Textiles
1460.36
1195.78
3.92
22.13
Cotton Yarn/Fabs./Madeups, Handloom products etc.
1439.44
987.76
3.86
45.73
Plastic and Linoleum
893.02
570.49
2.40
56.54
Rice
882.62
682.77
2.37
29.27
Total of 10 Major Commodity Groups
29576.85
20973.58
79.33
41.02
Rest
7708.21
6242.71
20.67
23.48
Total Exports
37285.07
27216.29
100.00
37.00
Top 10 major commodity groups covering 78% of total imports, are –
Statement 8: Imports of Top 10 Major Commodity Groups
Import (Million US$)
Share (%)
Growth (%)
Major Commodity Group
Dec-21
Dec-20
Dec-21
Dec-21 over Dec-20
Petroleum, Crude & products
15904.53
9629.01
26.83
65.17
Electronic goods
6532.02
5037.69
11.02
29.66
Gold
4690.68
4485.76
7.91
4.57
Machinery, electrical & non-electrical
3878.29
3149.33
6.54
23.15
Organic & Inorganic Chemicals
3224.79
1879.88
5.44
71.54
Pearls, precious & Semi-precious stones
2882.49
2397.17
4.86
20.25
Coal, Coke & Briquettes, etc.
2796.08
1624.32
4.72
72.14
Transport equipment
2265.75
2476.59
3.82
-8.51
Artificial resins, plastic materials, etc.
1961.81
1434.57
3.31
36.75
Vegetable Oil
1822.63
1210.88
3.07
50.52
Total of 10 Major Commodity Groups
45959.08
33325.21
77.54
37.91
Rest
13315.21
9609.34
22.46
38.57
Total Imports
59274.29
42934.54
100.00
38.06
***
DJ/PK
Saturday, 1 January 2022
Export Import Guide published by me
My dream come true. Thanks to JBS Academy for publishing my book *"A complete Guide for Export & Import"*

Subscribe to:
Posts (Atom)